Difference between revisions of "Energy - Electrical Usage Statistics"
(→Energy Usage Charts) |
(→Energy Usage Charts) |
||
| Line 19: | Line 19: | ||
<br style="clear:both;"/> | <br style="clear:both;"/> | ||
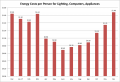
| − | [[Image:Energy Costs per Person | + | [[Image:Energy Costs per Person Light Jan 2018.png|650px|thumb|left|Energy Costs per Person for Lighting, Computers, Appliances Jan 2017 - Jan 2018]] |
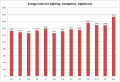
* Costs include the direct cost for electrical energy generation, distribution, and service connection charges, but exclude taxes and special charges. | * Costs include the direct cost for electrical energy generation, distribution, and service connection charges, but exclude taxes and special charges. | ||
Revision as of 16:10, 28 February 2018
return to Measurement Pages
We have 2 meters for energy, one for our HVAC system and one for any other electrical use, including computers, appliances and lighting.
Energy Usage Charts
There were 110 people in the building in January 2018

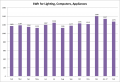
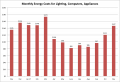
- These usage statistics include lighting, computers, chargers, refrigerator, dishwasher, microwave, printer, etc.

- These usage statistics include lighting, computers, chargers, refrigerator, dishwasher, microwave, printer, etc.
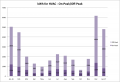
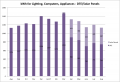
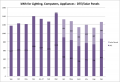
- Costs include the direct cost for electrical energy generation, distribution, and service connection charges, but exclude taxes and special charges.

- Costs include the direct cost for electrical energy generation, distribution, and service connection charges, but exclude taxes and special charges.

- These usage statistics include the heat pump, ventilation fans, hydronic pumps and valves, energy recovery unit, and domestic hot water.
- Peak period is between 10:00 AM and 7:00 PM May - Oct. Off-peak is 7:00 PM - 10:00 AM May - Oct.
- These usage statistics include the heat pump, ventilation fans, hydronic pumps and valves, energy recovery unit, and domestic hot water.
- Costs include the direct cost for electrical energy generation, distribution, and service connection charges, but exclude taxes and special charges.

- Costs include the direct cost for electrical energy generation, distribution, and service connection charges, but exclude taxes and special charges.
2017 Electrical Usage Charts
kWh for HVAC
Monthly kWh for HVAC (Peak/Off-Peak) January 2016 - January 2017

Monthly kWh for HVAC (Peak/Off-Peak) February 2016 - February 2017

Monthly kWh for HVAC (Peak/Off-Peak) March 2016 - March 2017

Monthly kWh for HVAC (Peak/Off-Peak) April 2016 - April 2017

Monthly kWh for HVAC (Peak/Off-Peak) May 2016 - May 2017

Monthly kWh for HVAC (Peak/Off-Peak) June 2016 - June 2017

Monthly kWh for HVAC (Peak/Off-Peak) July 2016 - July 2017

Monthly kWh for HVAC (Peak/Off-Peak) Aug 2016 - Aug 2017

Monthly kWh for HVAC (Peak/Off-Peak) Sep 2016 - Sep 2017

Monthly kWh for HVAC (Peak/Off-Peak) Oct 2016 - Oct 2017

Monthly kWh for HVAC (Peak/Off-Peak) Nov 2016 - Nov 2017

Monthly kWh for HVAC (Peak/Off-Peak) Dec 2016 - Dec 2017


kWh for non-HVAC (Lighting, Computers and Appliances)

Monthly kWh for Lighting, Computers, Appliances, January 2016 - January 2017
Monthly kWh for Lighting, Computers, Appliances, February 2016 - February 2017

Monthly kWh for Lighting, Computers, Appliances, March 2016 - March 2017

Monthly kWh for Lighting, Computers, Appliances, April 2016 - April 2017

Monthly kWh for Lighting, Computers, Appliances, May 2016 - May 2017

Monthly kWh for Lighting, Computers, Appliances, June 2016 - June 2017

Monthly kWh for Lighting, Computers, Appliances, July 2016 - July 2017
Monthly kWh for Lighting, Computers, Appliances, Aug 2016 - Aug 2017
Monthly kWh for Lighting, Computers, Appliances, Sep 2016 - Sep 2017

Monthly kWh for Lighting, Computers, Appliances, Oct 2016 - Oct 2017

Monthly kWh for Lighting, Computers, Appliances, Nov 2016 - Nov 2017

Monthly kWh for Lighting, Computers, Appliances, Dec 2016 - Dec 2017


Energy Costs for HVAC

Monthly costs for HVAC January 2016 - January 2017

Monthly costs for HVAC February 2016 - February 2017

Monthly costs for HVAC March 2016 - March 2017

Monthly costs for HVAC April 2016 - April 2017

Monthly costs for HVAC May 2016 - May 2017

Monthly costs for HVAC June 2016 - June 2017

Monthly costs for HVAC July 2016 - July 2017

Monthly costs for HVAC Aug 2016 - Aug 2017

Monthly costs for HVAC Sep 2016 - Sep 2017

Monthly costs for HVAC Oct 2016 - Oct 2017

Monthly costs for HVAC Nov 2016 - Nov 2017

Monthly costs for HVAC Dec 2016 - Dec 2017


Energy Costs for Lighting, Computers and Appliances

Monthly costs for Lighting, Computers, Appliances January 2016 - January 2017

Monthly costs for Lighting, Computers, Appliances February 2016 - February 2017
Monthly costs for Lighting, Computers, Appliances March 2016 - March 2017

Monthly costs for Lighting, Computers, Appliances April 2016 - April 2017

Monthly costs for Lighting, Computers, Appliances May 2016 - May 2017

Monthly costs for Lighting, Computers, Appliances June 2016 - June 2017

Monthly costs for Lighting, Computers, Appliances July 2016 - July 2017

Monthly costs for Lighting, Computers, Appliances Aug 2016 - Aug 2017

Monthly costs for Lighting, Computers, Appliances Sep 2016 - Sep 2017

Monthly costs for Lighting, Computers, Appliances Oct 2016 - Oct 2017
Monthly costs for Lighting, Computers, Appliances Nov 2016 - Nov 2017

Monthly costs for Lighting, Computers, Appliances Dec 2016 - Dec 2017


Energy Costs per Person for HVAC

Energy Costs per Person HVAC January 2016 - January 2017
Energy Costs per Person HVAC February 2016 - February 2017

Energy Costs per Person HVAC March 2016 - March 2017

Energy Costs per Person HVAC April 2016 - April 2017

Energy Costs per Person HVAC May 2016 - May 2017

Energy Costs per Person HVAC June 2016 - June 2017

Energy Costs per Person HVAC July 2016 - July 2017

Energy Costs per Person HVAC Aug 2016 - Aug 2017

Energy Costs per Person HVAC Sep 2016 - Sep 2017

Energy Costs per Person HVAC Oct 2016 - Oct 2017

Energy Costs per Person HVAC Nov 2016 - Nov 2017

Energy Costs per Person HVAC Dec 2016 - Dec 2017


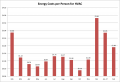
Energy Costs per Person for Lighting, Computers and Appliances

Energy Costs per Person for Lighting, Computers, Appliances January 2016 - January 2017

Energy Costs per Person for Lighting, Computers, Appliances February 2016 - February 2017

Energy Costs per Person for Lighting, Computers, Appliances March 2016 - March 2017

Energy Costs per Person for Lighting, Computers, Appliances April 2016 - April 2017

Energy Costs per Person for Lighting, Computers, Appliances May 2016 - May 2017

Energy Costs per Person for Lighting, Computers, Appliances June 2016 - June 2017

Energy Costs per Person for Lighting, Computers, Appliances July 2016 - July 2017

Energy Costs per Person for Lighting, Computers, Appliances Aug 2016 - Aug 2017

Energy Costs per Person for Lighting, Computers, Appliances Sep 2016 - Sep 2017

Energy Costs per Person for Lighting, Computers, Appliances Oct 2016 - Oct 2017

Energy Costs per Person for Lighting, Computers, Appliances Nov 2016 - Nov 2017
650px|thumb|left|Energy Costs per Person for Lighting, Computers, Appliances Dec 2016 - Dec 2017


See Also
For past years' charts, see Energy Charts Archives