Difference between revisions of "Energy - Electrical Usage Statistics"
(→Energy Usage Charts) |
|||
| Line 7: | Line 7: | ||
'''There were 102 people in the building in August 2019''' | '''There were 102 people in the building in August 2019''' | ||
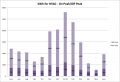
| − | [[Image:kWh for LCA | + | [[Image:kWh for LCA Aug 2019.png|650px|thumb|left|Monthly kWh for Lighting, Computers, Appliances, Aug 2018 - Aug 2019]] |
* These usage statistics include lighting, computers, chargers, refrigerator, dishwasher, microwave, printer, etc. | * These usage statistics include lighting, computers, chargers, refrigerator, dishwasher, microwave, printer, etc. | ||
| Line 13: | Line 13: | ||
<br style="clear:both;"/> | <br style="clear:both;"/> | ||
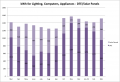
| − | [[Image:Energy Costs for LCA | + | [[Image:Energy Costs for LCA Aug 2019.png|650px|thumb|left|Monthly costs for Lighting, Computers, Appliances Aug 2018 - Aug 2019]] |
* These usage statistics include lighting, computers, chargers, refrigerator, dishwasher, microwave, printer, etc. | * These usage statistics include lighting, computers, chargers, refrigerator, dishwasher, microwave, printer, etc. | ||
* Costs include the direct cost for electrical energy generation, distribution, and service connection charges, but exclude taxes and special charges. | * Costs include the direct cost for electrical energy generation, distribution, and service connection charges, but exclude taxes and special charges. | ||
| Line 19: | Line 19: | ||
<br style="clear:both;"/> | <br style="clear:both;"/> | ||
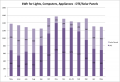
| − | [[Image:Energy Costs per Person for LCA | + | [[Image:Energy Costs per Person for LCA Aug 2019.png|650px|thumb|left|Energy Costs per Person for Lighting, Computers, Appliances Aug 2018 - Aug 2019]] |
* Costs include the direct cost for electrical energy generation, distribution, and service connection charges, but exclude taxes and special charges. | * Costs include the direct cost for electrical energy generation, distribution, and service connection charges, but exclude taxes and special charges. | ||
| Line 26: | Line 26: | ||
---- | ---- | ||
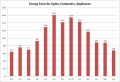
| − | [[Image:kWh for HVAC | + | [[Image:kWh for HVAC Aug 2019.png|650px|thumb|left|Monthly kWh for HVAC (Peak/Off-Peak) Aug 2018 - Aug 2019]] |
* These usage statistics include the heat pump, ventilation fans, hydronic pumps and valves, energy recovery unit, and domestic hot water. | * These usage statistics include the heat pump, ventilation fans, hydronic pumps and valves, energy recovery unit, and domestic hot water. | ||
| Line 34: | Line 34: | ||
---- | ---- | ||
| − | [[Image:Energy Costs for HVAC | + | [[Image:Energy Costs for HVAC Aug 2019.png|650px|thumb|left|Monthly costs for HVAC Aug 2018 - Aug 2019]] |
* These usage statistics include the heat pump, ventilation fans, hydronic pumps and valves, energy recovery unit, and domestic hot water. | * These usage statistics include the heat pump, ventilation fans, hydronic pumps and valves, energy recovery unit, and domestic hot water. | ||
* Costs include the direct cost for electrical energy generation, distribution, and service connection charges, but exclude taxes and special charges. | * Costs include the direct cost for electrical energy generation, distribution, and service connection charges, but exclude taxes and special charges. | ||
| Line 40: | Line 40: | ||
<br style="clear:both;"/> | <br style="clear:both;"/> | ||
---- | ---- | ||
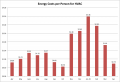
| − | [[Image:Energy Costs per Person for HVAC | + | [[Image:Energy Costs per Person for HVAC Aug 2019.png|650px|thumb|left|Energy Costs per Person HVAC Aug 2018 - Aug 2019]] |
* Costs include the direct cost for electrical energy generation, distribution, and service connection charges, but exclude taxes and special charges. | * Costs include the direct cost for electrical energy generation, distribution, and service connection charges, but exclude taxes and special charges. | ||
Revision as of 14:59, 11 October 2019
return to Measurement Pages
We have 2 meters for energy, one for our HVAC system and one for any other electrical use, including computers, appliances and lighting.
Energy Usage Charts
There were 102 people in the building in August 2019

- These usage statistics include lighting, computers, chargers, refrigerator, dishwasher, microwave, printer, etc.

- These usage statistics include lighting, computers, chargers, refrigerator, dishwasher, microwave, printer, etc.
- Costs include the direct cost for electrical energy generation, distribution, and service connection charges, but exclude taxes and special charges.
- Costs include the direct cost for electrical energy generation, distribution, and service connection charges, but exclude taxes and special charges.

- These usage statistics include the heat pump, ventilation fans, hydronic pumps and valves, energy recovery unit, and domestic hot water.
- Peak period is between 10:00 AM and 7:00 PM May - Oct. Off-peak is 7:00 PM - 10:00 AM May - Oct.

- These usage statistics include the heat pump, ventilation fans, hydronic pumps and valves, energy recovery unit, and domestic hot water.
- Costs include the direct cost for electrical energy generation, distribution, and service connection charges, but exclude taxes and special charges.

- Costs include the direct cost for electrical energy generation, distribution, and service connection charges, but exclude taxes and special charges.
2017 Electrical Usage Charts
kWh for HVAC

Monthly kWh for HVAC (Peak/Off-Peak) Jan 2018 - Jan 2019

Monthly kWh for HVAC (Peak/Off-Peak) Feb 2018 - Feb 2019

Monthly kWh for HVAC (Peak/Off-Peak) Mar 2018 - Mar 2019

Monthly kWh for HVAC (Peak/Off-Peak) Apr 2018 - Apr 2019

Monthly kWh for HVAC (Peak/Off-Peak) May 2018 - May 2019
Monthly kWh for HVAC (Peak/Off-Peak) Jun 2018 - Jun 2019

Monthly kWh for HVAC (Peak/Off-Peak) Jul 2018 - Jul 2019


kWh for non-HVAC (Lighting, Computers and Appliances)

Monthly kWh for Lighting, Computers, Appliances, Jan 2018 - Jan 2019

Monthly kWh for Lighting, Computers, Appliances, Feb 2018 - Feb 2019
Monthly kWh for Lighting, Computers, Appliances, Mar 2018 - Mar 2019

Monthly kWh for Lighting, Computers, Appliances, Apr 2018 - Apr 2019
Monthly kWh for Lighting, Computers, Appliances, May 2018 - May 2019

Monthly kWh for Lighting, Computers, Appliances, Jun 2018 - Jun 2019

Monthly kWh for Lighting, Computers, Appliances, Jul 2018 - Jul 2019


Energy Costs for HVAC

Monthly costs for HVAC Jan 2018 - Jan 2019

Monthly costs for HVAC Feb 2018 - Feb 2019

Monthly costs for HVAC Mar 2018 - Mar 2019

Monthly costs for HVAC Apr 2018 - Apr 2019

Monthly costs for HVAC May 2018 - May 2019

Monthly costs for HVAC Jun 2018 - Jun 2019

Monthly costs for HVAC Jul 2018 - Jul 2019


Energy Costs for Lighting, Computers and Appliances

Monthly costs for Lighting, Computers, Appliances Jan 2018 - Jan 2019

Monthly costs for Lighting, Computers, Appliances Feb 2018 - Feb 2019

Monthly costs for Lighting, Computers, Appliances Mar 2018 - Mar 2019

Monthly costs for Lighting, Computers, Appliances Apr 2018 - Apr 2019

Monthly costs for Lighting, Computers, Appliances May 2018 - May 2019
Monthly costs for Lighting, Computers, Appliances Jun 2018 - Jun 2019

Monthly costs for Lighting, Computers, Appliances Jul 2018 - Jul 2019


Energy Costs per Person for HVAC

Energy Costs per Person HVAC Jan 2018 - Jan 2019

Energy Costs per Person HVAC Feb 2018 - Feb 2019

Energy Costs per Person HVAC Mar 2018 - Mar 2019
Energy Costs per Person HVAC Apr 2018 - Apr 2019

Energy Costs per Person HVAC May 2018 - May 2019

Energy Costs per Person HVAC Jun 2018 - Jun 2019

Energy Costs per Person HVAC Jul 2018 - Jul 2019


Energy Costs per Person for Lighting, Computers and Appliances

Energy Costs per Person for Lighting, Computers, Appliances Jan 2018 - Jan 2019

Energy Costs per Person for Lighting, Computers, Appliances Feb 2018 - Feb 2019

Energy Costs per Person for Lighting, Computers, Appliances Mar 2018 - Mar 2019

Energy Costs per Person for Lighting, Computers, Appliances Apr 2018 - Apr 2019

Energy Costs per Person for Lighting, Computers, Appliances May 2018 - May 2019

Energy Costs per Person for Lighting, Computers, Appliances Jun 2018 - Jun 2019

Energy Costs per Person for Lighting, Computers, Appliances Jul 2018 - Jul 2019


See Also
For past years' charts, see Energy Charts Archives