Difference between revisions of "Water Usage Statistics"
(→April 2023 Monthly Water Usage Charts) |
|||
| (94 intermediate revisions by the same user not shown) | |||
| Line 25: | Line 25: | ||
* Outdoor watering. We harvest the water that we use for outdoor watering in 2 cisterns (1,700 gallons total) and only use city water when the other water is exhausted. Our goal is to use no city water for outdoor use. | * Outdoor watering. We harvest the water that we use for outdoor watering in 2 cisterns (1,700 gallons total) and only use city water when the other water is exhausted. Our goal is to use no city water for outdoor use. | ||
| − | == | + | == Current 2023 Water Usage Charts== |
| − | '''There were | + | '''Current Charts: There were 79 people in the building in Dec 2023''' |
| − | [[Image:GG Water Use | + | [[Image:GG Monthly Water Use Dec 2023.png|650px|thumb|left|Monthly Water Use in gallons]] |
| − | [[Image:GG Water Use vs Ind Std | + | [[Image:GG Monthly Water Use vs Ind Std Dec 2023.png|650px|thumb|left|Monthly Water Use vs. Industry Standard]] |
| − | [[Image:GG Water Costs | + | [[Image:GG Monthly Water Costs Dec 2023.png|650px|thumb|left|Monthly Water Costs]] |
| − | [[Image:GG Water Costs per Person | + | [[Image:GG Monthly Water Costs per Person Dec 2023.png|650px|thumb|left|Water Costs per Person]] |
| − | [[Image:GG Water Use per Person vs Ind Std | + | [[Image:GG Monthly Water Use per Person vs Ind Std Dec 2023.png|650px|thumb|left|Water Use per Person vs Industry Standard]] |
| Line 57: | Line 57: | ||
<br style="clear:both;"/> | <br style="clear:both;"/> | ||
| − | |||
| Line 65: | Line 64: | ||
---- | ---- | ||
| − | == | + | =='''November 2023 Monthly Water Usage Charts'''== |
| + | <gallery> | ||
| + | Image:GG Monthly Water Use Nov 2023.png|Monthly Water Use in gallons | ||
| − | + | Image:GG Monthly Water Use vs Ind Std Nov 2023.png|Monthly Water Use vs. Industry Standard | |
| − | + | Image:GG Monthly Water Costs Nov 2023.png|Monthly Water Costs | |
| − | Image:GG Water | + | |
| − | + | ||
| − | + | Image:GG Monthly Water Costs per Person Nov 2023.png|Water Costs per Person | |
| + | |||
| + | Image:GG Water Use per Person vs Ind Std Nov 2023.png|Water Use per Person vs Industry Standard | ||
| − | |||
| − | |||
</gallery> | </gallery> | ||
| − | == | + | =='''October 2023 Monthly Water Usage Charts'''== |
| − | + | ||
<gallery> | <gallery> | ||
| − | Image:GG Water Costs | + | Image:GG Monthly Water Use Oct 2023.png|Monthly Water Use in gallons |
| − | + | Image:GG Monthly Water Use vs Ind Std Oct 2023.png|Monthly Water Use vs. Industry Standard | |
| + | Image:GG Monthly Water Costs Oct 2023.png|Monthly Water Costs | ||
| + | Image:GG Water Costs per Person Oct 2023.png|Water Costs per Person | ||
| + | Image:GG Water Use per Person vs Ind Std Oct 2023.png|Water Use per Person vs Industry Standard | ||
| − | |||
| − | |||
| − | |||
</gallery> | </gallery> | ||
| − | == | + | =='''September 2023 Monthly Water Usage Charts'''== |
| − | + | ||
<gallery> | <gallery> | ||
| − | |||
| − | |||
| − | + | Image:GG Monthly Water Use Sep 2023.png|Monthly Water Use in gallons | |
| − | + | Image:GG Monthly Water Use vs Ind Std Sep 2023.png|Monthly Water Use vs. Industry Standard | |
| + | Image:GG Monthly Water Costs Sep 2023.png|Monthly Water Costs | ||
| − | + | Image:GG Monthly Water Costs per Person Sep 2023.png|Water Costs per Person | |
| − | + | Image:GG Monthly Water Use per Person vs Ind Std Sep 2023.png|Water Use per Person vs Industry Standard | |
| − | Image: | + | |
| − | + | ||
</gallery> | </gallery> | ||
| − | == | + | =='''August 2023 Monthly Water Usage Charts'''== |
<gallery> | <gallery> | ||
| − | Image: | + | |
| − | Image:GG Water | + | Image:GG Monthly Water Use Aug 2023.png|Monthly Water Use in gallons |
| + | |||
| + | Image:GG Water Use vs Ind Std Aug 2023.png|Monthly Water Use vs. Industry Standard | ||
| + | |||
| + | Image:GG Monthly Water Costs Aug 2023.png|Monthly Water Costs | ||
| + | |||
| + | Image:GG Water Costs per Person Aug 2023.png|Water Costs per Person | ||
| + | |||
| + | Image:GG Water Use per Person vs Ind Std Aug 2023.png|Water Use per Person vs Industry Standard | ||
</gallery> | </gallery> | ||
| − | == | + | =='''July 2023 Monthly Water Usage Charts'''== |
<gallery> | <gallery> | ||
| − | Image: | + | |
| − | Image:GG Water Use vs Ind Std | + | Image:GG Monthly Water Use Jul 2023.png|Monthly Water Use in gallons |
| + | |||
| + | Image:GG Water Use vs Ind Std Jul 2023.png|Monthly Water Use vs. Industry Standard | ||
| + | |||
| + | Image:GG Monthly Water Costs Jul 2023.png|Monthly Water Costs | ||
| + | |||
| + | Image:GG Water Costs per Person Jul 2023.png|Water Costs per Person | ||
| + | |||
| + | Image:GG Water Use per Person vs Ind Std Jul 2023.png|Water Use per Person vs Industry Standard | ||
| + | |||
| + | |||
</gallery> | </gallery> | ||
| − | == | + | =='''May 2023 Monthly Water Usage Charts'''== |
| + | |||
<gallery> | <gallery> | ||
| − | Image: | + | |
| − | Image:GG Monthly Water Costs.png| | + | Image:GG Water Use May 2023.png|Monthly Water Use in gallons |
| + | |||
| + | Image:GG Water Use vs Ind Std May 2023.png|Monthly Water Use vs. Industry Standard | ||
| + | |||
| + | Image:GG Water Costs May 2023.png|Monthly Water Costs | ||
| + | |||
| + | Image:GG Water Costs per Person May 2023.png|Water Costs per Person | ||
| + | |||
| + | Image:GG Water Use per Person vs Ind Std May 2023.png|Water Use per Person vs Industry Standard | ||
| + | |||
</gallery> | </gallery> | ||
| − | == | + | =='''April 2023 Monthly Water Usage Charts'''== |
| + | |||
<gallery> | <gallery> | ||
| − | Image: | + | Image:GG Monthly Water Use Apr 2023.png|Monthly Water Use in gallons, Apr 2023 |
| − | Image:GG | + | |
| + | Image:GG Monthly Water Use vs Ind Std Apr 2023.png|Monthly Water Use vs. Industry Standard | ||
| + | |||
| + | Image:GG Water Costs Apr 2023.png|Monthly Water Costs | ||
| + | |||
| + | Image:GG Water Costs per Person Apr 2023.png|Water Costs per Person | ||
| + | |||
| + | Image:GG Water Use per Person vs Ind Std Apr 2023.png|Water Use per Person vs Industry Standard | ||
| + | |||
</gallery> | </gallery> | ||
Latest revision as of 19:53, 31 January 2024
return to Measurement Pages
Our goal with water usage was to use water at a fraction of a level of a traditional commercial office building. We did this in a variety of ways, from selection of efficient plumbing fixtures to reduction of use of city water through the use of cisterns. Our data is below.

Contents
- 1 Measurement Decisions
- 2 Sources of Water
- 3 Uses of Water
- 4 Current 2023 Water Usage Charts
- 5 November 2023 Monthly Water Usage Charts
- 6 October 2023 Monthly Water Usage Charts
- 7 September 2023 Monthly Water Usage Charts
- 8 August 2023 Monthly Water Usage Charts
- 9 July 2023 Monthly Water Usage Charts
- 10 May 2023 Monthly Water Usage Charts
- 11 April 2023 Monthly Water Usage Charts
- 12 See Also
Measurement Decisions
- The statistics come from our monthly City of Detroit water bills.
- Unit of measure = gallons (water dept measures in cu, where 1cu = 100 cubic feet = 728 gallons)
- 'Usage Per Person' is calculated based on the number of people that are in Businesses-in-Residence at the beginning of each month, plus the number of volunteers and paid contractors that work more than 2 days a week.
Sources of Water
- Our water comes from the City of Detroit Water and Sewerage Department, which gets its water from the Detroit River and Lake Huron.
- Water for outside use comes from 2 cisterns, one on top of our roof, and one under our parking lot. Together, they collect about 2,000 gallons of water.
Uses of Water
- 4 Toilets (@ 1.28 gal/flush)
- 5 Sinks
- 3 Bathroom (0.5 gal/min + automated)
- 1 Kitchen
- 1 Mop-basin
- 2 Dishwasher (4 gal / load)
- 1 Shower (2.5 gal/min shower head)
- Coffee / Drinking
- Outdoor watering. We harvest the water that we use for outdoor watering in 2 cisterns (1,700 gallons total) and only use city water when the other water is exhausted. Our goal is to use no city water for outdoor use.
Current 2023 Water Usage Charts
Current Charts: There were 79 people in the building in Dec 2023


- Studies show water usage per person per month in office space is between 300-500 gallons, so we are using about 1/10th of the water typically used in office buildings with similar numbers of people. sources: US Department of Energy Federal Office Building Water Efficiency Report and North Carolina Division of Water Quality
November 2023 Monthly Water Usage Charts

Monthly Water Use in gallons

Monthly Water Use vs. Industry Standard

Monthly Water Costs

Water Costs per Person

Water Use per Person vs Industry Standard


October 2023 Monthly Water Usage Charts

Monthly Water Use in gallons

Monthly Water Use vs. Industry Standard
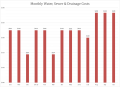
Monthly Water Costs

Water Costs per Person

Water Use per Person vs Industry Standard


September 2023 Monthly Water Usage Charts

Monthly Water Use in gallons

Monthly Water Use vs. Industry Standard

Monthly Water Costs

Water Costs per Person

Water Use per Person vs Industry Standard


August 2023 Monthly Water Usage Charts

Monthly Water Use in gallons

Monthly Water Use vs. Industry Standard

Monthly Water Costs

Water Costs per Person

Water Use per Person vs Industry Standard


July 2023 Monthly Water Usage Charts

Monthly Water Use in gallons

Monthly Water Use vs. Industry Standard

Monthly Water Costs

Water Costs per Person

Water Use per Person vs Industry Standard


May 2023 Monthly Water Usage Charts

Monthly Water Use in gallons

Monthly Water Use vs. Industry Standard

Monthly Water Costs

Water Costs per Person

Water Use per Person vs Industry Standard


April 2023 Monthly Water Usage Charts

Monthly Water Use in gallons, Apr 2023

Monthly Water Use vs. Industry Standard

Monthly Water Costs

Water Costs per Person

Water Use per Person vs Industry Standard


