Difference between revisions of "Waste Statistics"
| Line 24: | Line 24: | ||
== Waste Measurement Charts == | == Waste Measurement Charts == | ||
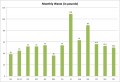
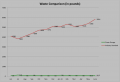
| − | '''In | + | '''In October 2015, there were 97 people in the building'''. |
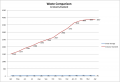
| − | [[Image:Monthly Waste | + | [[Image:Monthly Waste Oct 2015.png|650px|left|thumb|Monthly Waste in pounds, Oct 2014 - Oct 2015]] |
| Line 34: | Line 34: | ||
---- | ---- | ||
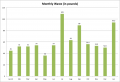
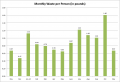
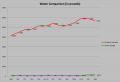
| − | [[Image:Monthly Waste per Person | + | [[Image:Monthly Waste per Person Oct 2015.png|650px|left|thumb|Monthly waste statistics per person, Oct 2014 - Oct 2015]] |
| Line 40: | Line 40: | ||
---- | ---- | ||
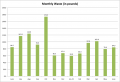
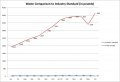
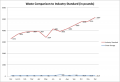
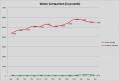
| − | [[Image:Monthly Waste vs Ind Std | + | [[Image:Monthly Waste vs Ind Std Oct 2015.png|650px|left|thumb|Monthly waste comparison, Green Garage vs industry standard for Oct 2015]] |
This chart compares our waste output with an [http://www.nyc.gov/html/oec/html/ceqr/technical_manual_2012.shtml industry standard for office space] of 13 pounds of waste per person per week, or about 56 pounds of waste per person per month. As the number of people in the building has risen throughout the year, our waste numbers have remained surprisingly constant. The hypothetical 'industry standard' red line shows how these numbers might have looked if we were a typical office building. | This chart compares our waste output with an [http://www.nyc.gov/html/oec/html/ceqr/technical_manual_2012.shtml industry standard for office space] of 13 pounds of waste per person per week, or about 56 pounds of waste per person per month. As the number of people in the building has risen throughout the year, our waste numbers have remained surprisingly constant. The hypothetical 'industry standard' red line shows how these numbers might have looked if we were a typical office building. | ||
| Line 48: | Line 48: | ||
---- | ---- | ||
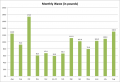
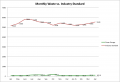
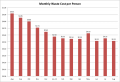
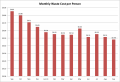
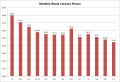
| − | [[Image:Waste Cost per Person | + | [[Image:Waste Cost per Person Oct 2015.png|650px|left|thumb|Monthly waste cost per person, Oct 2014 - Oct 2015]] |
Revision as of 16:33, 18 December 2015
return to Measurement Pages
Contents
Measurement Decisions

- Unit of measure = pounds per week
- Per person is the number of people that are in the Businesses in Residence and regular volunteers
- Industry standards for waste per person/per month were taken from: NYC Mayor's Office on Environmental Coordination (Chapter 14)

Sources of Waste
- offices
- kitchen
- bathrooms
- our Friday community lunch
Waste Destinations
- Garbage goes out on Fridays. It is picked up by the City of Detroit Department of Public Services.
- Recycled material (paper, cardboard, styrofoam, glass, metal and plastics) is picked up weekly by Recycle Here.
- Compost goes to 2 locations: Palmer Park, where we mix it with spent brewing grains from Motor City Brewing Works and horse manure; and some to our worms, located in the greenhouse. We compost approximately 5 pounds of food scraps per day, 25 per week.
Waste Measurement Charts
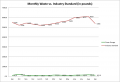
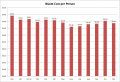
In October 2015, there were 97 people in the building.


This chart compares our waste output with an industry standard for office space of 13 pounds of waste per person per week, or about 56 pounds of waste per person per month. As the number of people in the building has risen throughout the year, our waste numbers have remained surprisingly constant. The hypothetical 'industry standard' red line shows how these numbers might have looked if we were a typical office building.

Past Waste Measurement Charts
Monthly Waste (in pounds)
- Monthly waste amounts.png
Monthly waste statistics, Feb 2012 - Feb 2013

Monthly waste statistics, March 2012 - March 2013

Monthly waste statistics, April 2012 - April 2013

Monthly waste statistics, May 2012 - May 2013

Monthly waste statistics, June 2012 - June 2013

Monthly waste statistics, July 2012 - July 2013

Monthly Waste in pounds, August 2012 - August 2013

Monthly Waste in pounds, Sept 2012 - Sept 2013

Monthly Waste in pounds, Oct 2012 - Oct 2013

Monthly Waste in pounds, Nov 2012 - Nov 2013
Monthly Waste in pounds, December 2012 - December 2013
Monthly Waste in pounds, January 2013 - January 2014

Monthly Waste in pounds, Feb 2013 - Feb 2014

Monthly Waste in pounds, March 2013 - March 2014

Monthly Waste in pounds, April 2013 - April 2014

Monthly Waste in pounds, May 2013 - May 2014

Monthly Waste in pounds, June 2013 - June 2014

Monthly Waste in pounds, July 2013 - July 2014

Monthly Waste in pounds, August 2013 - August 2014

Monthly Waste in pounds, September 2013 - September 2014

Monthly Waste in pounds, October 2013 - October 2014

Monthly Waste in pounds, November 2013 - November 2014

Monthly Waste in pounds, December 2013 - December 2014

Monthly Waste in pounds, January 2014 - January 2015

Monthly Waste in pounds, February 2014 - February 2015

Monthly Waste in pounds, March 2014 - March 2015

Monthly Waste in pounds, April 2014 - April 2015

Monthly Waste in pounds, May 2014 - May 2015
Monthly Waste in pounds, June 2014 - June 2015

Monthly Waste in pounds, July 2014 - July 2015
Monthly Waste in pounds, Aug 2014 - Aug 2015

Monthly Waste in pounds, Sep 2014 - Sep 2015


Monthly Waste per Person (in pounds)

Monthly waste statistics per person, Feb 2012 - Feb 2013

Monthly waste statistics per person, March 2012 - March 2013
- Waste per person a-a.png
Monthly waste statistics per person, April 2012 - April 2013

Monthly waste statistics per person, May 2012 - May 2013
Monthly waste statistics per person, June 2012 - June 2013

Monthly waste statistics per person, July 2012 - July 2013

Monthly waste statistics per person, August 2012 - August 2013

Monthly waste statistics per person, Sept 2012 - Sept 2013

Monthly waste statistics per person, Oct 2012 - Oct 2013

Monthly waste statistics per person, Nov 2012 - Nov 2013

Monthly waste statistics per person, December 2012 - December 2013

Monthly waste statistics per person, January 2013 - January 2014

Monthly waste statistics per person, Feb 2013 - Feb 2014

Monthly waste per person, March 2013 - March 2014

Monthly waste per person, April 2013 - April 2014

Monthly waste statistics per person, May 2013 - May 2014

Monthly waste statistics per person, June 2013 - June 2014

Monthly waste statistics per person, July 2013 - July 2014

Monthly waste statistics per person, August 2013 - August 2014

Monthly waste statistics per person, September 2013 - September 2014

Monthly waste statistics per person, October 2013 - October 2014
Monthly waste statistics per person, November 2013 - November 2014

Monthly waste statistics per person, December 2013 - December 2014

Monthly waste statistics per person, January 2014 - January 2015

Monthly waste statistics per person, February 2014 - February 2015

Monthly waste statistics per person, March 2014 - March 2015

Monthly waste statistics per person, April 2014 - April 2015

Monthly waste statistics per person, May 2014 - May 2015

Monthly waste statistics per person, June 2014 - June 2015

Monthly waste statistics per person, July 2014 - July 2015

Monthly waste statistics per person, Aug 2014 - Aug 2015

Monthly waste statistics per person, Sep 2014 - Sep 2015


Monthly Waste Comparison to Industry Standard

Monthly waste comparison, Feb 2012 - Feb 2013, Green Garage vs industry standards

Monthly waste comparison, March 2012 - March 2013, Green Garage vs industry standards
Monthly waste comparison, Apr 2012 - Apr 2013, Green Garage vs industry standards
Monthly waste comparison, May 2012 - May 2013
Monthly waste comparison, June 2012 - June 2013

Monthly waste comparison, July 2013 - July 2013

Monthly waste comparison, August 2012 - August 2013

Monthly waste comparison, Sept 2012 - Sept 2013

Monthly waste comparison, Oct 2012 - Oct 2013
- Waste Comparison Nov 2013.png
Monthly waste comparison, Nov 2012 - Nov 2013
Monthly waste comparison, December 2012 - December 2013

Monthly waste comparison, January 2013 - January 2014

Monthly waste comparison, February 2013 - February 2014

Monthly waste comparison, March 2013 - March 2014

Monthly waste comparison, April 2013 - April 2014

Monthly waste comparison, May 2013 - May 2014
Monthly waste comparison, Green Garage vs industry standard for June 2014

Monthly waste comparison, Green Garage vs industry standard for July 2014
Monthly waste comparison, Green Garage vs industry standard for August 2014
Monthly waste comparison, Green Garage vs industry standard for September 2014

Monthly waste comparison, Green Garage vs industry standard for October 2014

Monthly waste comparison, Green Garage vs industry standard for Nov 2014

Monthly waste comparison, Green Garage vs industry standard for Dec 2014

Monthly waste comparison, Green Garage vs industry standard for January 2015

Monthly waste comparison, Green Garage vs industry standard for February 2015

Monthly waste comparison, Green Garage vs industry standard for March 2015
Monthly waste comparison, Green Garage vs industry standard for April 2015

Monthly waste comparison, Green Garage vs industry standard for May 2015

Monthly waste comparison, Green Garage vs industry standard for June 2015

Monthly waste comparison, Green Garage vs industry standard for July 2015

Monthly waste comparison, Green Garage vs industry standard for Aug 2015
Monthly waste comparison, Green Garage vs industry standard for Sep 2015


Monthly Waste Cost per Person

Monthly waste cost per person, Feb 2012 - Feb 2013

Monthly waste cost per person, March 2012 - March 2013

Monthly waste cost per person, April 2012 - April 2013

Monthly waste cost per person, May 2012 - May 2013

Monthly waste cost per person, June 2012 - June 2013

Monthly waste cost per person, July 2012 - July 2013
Monthly waste cost per person, August 2012 - August 2013
Monthly waste cost per person, Sept 2012 - Sept 2013
Monthly waste cost per person, Oct 2012 - Oct 2013

Monthly waste cost per person, Nov 2012 - Nov 2013

Monthly waste cost per person, December 2012 - December 2013

Monthly waste cost per person, January 2013 - January 2014

Monthly waste cost per person, February 2013 - February 2014

Monthly waste cost per person, March 2013 - March 2014

Monthly waste cost per person, April 2013 - April 2014

Monthly waste cost per person, May 2013 - May 2014

Monthly waste cost per person, June 2013 - June 2014

Monthly waste cost per person, July 2013 - July 2014

Monthly waste cost per person, August 2013 - August 2014

Monthly waste cost per person, September 2013 - September 2014

Monthly waste cost per person, October 2013 - October 2014
Monthly waste cost per person, November 2013 - November 2014

Monthly waste cost per person, December 2013 - December 2014

Monthly waste cost per person, January 2014 - January 2015

Monthly waste cost per person, February 2014 - February 2015

Monthly waste cost per person, March 2014 - March 2015

Monthly waste cost per person, April 2014 - April 2015

Monthly waste cost per person, May 2014 - May 2015

Monthly waste cost per person, June 2014 - June 2015

Monthly waste cost per person, July 2014 - July 2015

Monthly waste cost per person, Aug 2014 - Aug 2015

Monthly waste cost per person, Sep 2014 - Sep 2015


See Also
For more detail, visit our As Built pages, detailing the work in these areas:
For past years' charts, see Monthly Waste Archives