Difference between revisions of "Energy - Electrical Usage Statistics"
| (582 intermediate revisions by 2 users not shown) | |||
| Line 1: | Line 1: | ||
<small>return to [[Measurement Pages]]</small> | <small>return to [[Measurement Pages]]</small> | ||
| − | We have 2 meters for energy, one for our HVAC system and one for any other electrical use, including computers and lighting. | + | We have 2 meters for energy, one for our HVAC system and one for any other electrical use, including computers, appliances and lighting. |
| − | |||
| − | |||
| − | + | =='''Current 2023 Usage Charts'''== | |
| − | * These usage statistics include lighting, | + | * There were 79 people in the building in Dec 2023 |
| + | |||
| + | |||
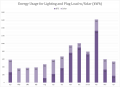
| + | [[Image:GG DTE kWh for PL w Solar Dec 2023.png|650px|thumb|left|Monthly kWh for Lighting and Plug Load with Solar]] | ||
| + | |||
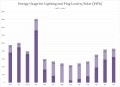
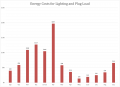
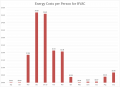
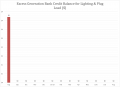
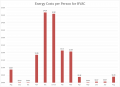
| + | * These usage statistics show total kWh used each month from both DTE and solar panel generation and include lighting, appliances and all other plug loads. | ||
<br style="clear:both;"/> | <br style="clear:both;"/> | ||
| − | |||
| − | |||
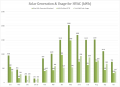
| − | * | + | [[Image:GG Solar Gen & Usage for PL Dec 2023.png|650px|thumb|left|Solar Generation and Usage for Lighting and Plug Load (kWh)]] |
| + | |||
| + | * This chart shows Solar kWh generated, kWh Outflow, and total Solar kWh Usage for Green Garage lighting and plug loads. | ||
| + | |||
| + | <br style="clear:both;"/> | ||
| + | |||
| + | |||
| + | <br style="clear:both;"/> | ||
| + | |||
| + | |||
| + | [[Image:GG Energy Costs for PL Dec 2023.png|650px|thumb|left|Energy Costs for Lighting and Plug Loads]] | ||
| + | |||
| + | <br style="clear:both;"/> | ||
| + | |||
| + | |||
| + | [[Image:GG Energy Costs per Person for PL Dec 2023.png|650px|thumb|left|Energy Costs per Person for Lighting and Plug Loads]] | ||
| + | |||
| + | <br style="clear:both;"/> | ||
| + | |||
| + | |||
| + | [[Image:GG kWh for HVAC Dec 2023.png|650px|thumb|left|kWh for HVAC showing on-peak and off-peak hours]] | ||
| + | |||
* Peak period is between 10:00 AM and 7:00 PM May - Oct. Off-peak is 7:00 PM - 10:00 AM May - Oct. | * Peak period is between 10:00 AM and 7:00 PM May - Oct. Off-peak is 7:00 PM - 10:00 AM May - Oct. | ||
| + | |||
<br style="clear:both;"/> | <br style="clear:both;"/> | ||
| − | |||
| − | [[Image: | + | |
| − | + | [[Image:GG kWh for HVAC w Solar Dec 2023.png|650px|thumb|left|kWh for HVAC with Solar]] | |
| − | + | ||
<br style="clear:both;"/> | <br style="clear:both;"/> | ||
| − | + | ||
| − | [[Image: | + | |
| − | * | + | [[Image:GG Solar Gen & Usage for HVAC Dec 2023.png|650px|thumb|left|Solar Generation and Usage for HVAC]] |
| − | + | ||
| + | * This chart shows solar kWh generated, kWh outflow, and solar kWh usage for HVAC. | ||
<br style="clear:both;"/> | <br style="clear:both;"/> | ||
| − | |||
| − | |||
| − | |||
| + | |||
| + | [[Image:GG EGB kWh Bal for HVAC Dec 2023.png|650px|thumb|left|Excess Generation Bank Balance for HVAC (kWh)]] | ||
<br style="clear:both;"/> | <br style="clear:both;"/> | ||
| − | |||
| − | |||
| − | |||
| + | |||
| + | [[Image:GG EGB $ Cr Bal for HVAC Dec 2023.png|650px|thumb|left|Excess Generation Bank credit balance in dollars for HVAC]] | ||
<br style="clear:both;"/> | <br style="clear:both;"/> | ||
| − | |||
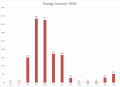
| − | ===''' | + | [[Image:GG Energy Costs for HVAC Dec 2023.png|650px|thumb|left|Energy Costs for HVAC]] |
| + | |||
| + | * These usage statistics include the heat pump, ventilation fans, hydronic pumps and valves, energy recovery unit, and domestic hot water. | ||
| + | * Costs include the direct cost for electrical energy generation, distribution, and service connection charges, but exclude taxes and special charges. | ||
| + | |||
| + | <br style="clear:both;"/> | ||
| + | |||
| + | |||
| + | [[Image:GG Energy Costs per Person for HVAC Dec 2023.png|650px|thumb|left|Energy Costs per Person for HVAC]] | ||
| + | |||
| + | |||
| + | |||
| + | <br style="clear:both;"/> | ||
| + | |||
| + | =='''Nov 2023 Energy Usage Charts'''== | ||
<gallery> | <gallery> | ||
| − | Image: | + | Image:GG DTE kWh for PL w Solar Nov 2023.png|Monthly kWh for Lighting and Plug Load with Solar |
| − | Image: | + | Image:GG Solar Gen & Usage for PL Nov 2023.png|Solar Generation and Usage for Lighting and Plug Load (kWh) |
| − | Image: | + | Image:GG Energy Costs for PL Nov 2023.png|Energy Costs for Lighting and Plug Loads |
| − | Image: kWh for HVAC | + | Image:GG Energy Costs per Person for PL Nov 2023.png|Energy Costs per Person for Lighting and Plug Loads |
| + | |||
| + | Image:GG kWh for HVAC Nov 2023.png|kWh for HVAC showing on-peak and off-peak hours | ||
| + | |||
| + | Image:GG kWh for HVAC w Solar Nov 2023.png|kWh for HVAC with Solar | ||
| + | |||
| + | Image:GG Solar Gen & Usage for HVAC Nov 2023.png|Solar Generation and Usage for HVAC | ||
| + | |||
| + | Image:GG EGB kWh Bal for HVAC Nov 2023.png|Excess Generation Bank Balance for HVAC (kWh) | ||
| + | |||
| + | Image:GG EGB $ Cr Bal for HVAC Nov 2023.png|Excess Generation Bank credit balance in dollars for HVAC | ||
| + | |||
| + | Image:GG Energy Costs for HVAC Nov 2023.png|Energy Costs for HVAC | ||
| + | |||
| + | Image:GG Energy Costs per Person for HVAC Nov 2023.png|Energy Costs per Person for HVAC | ||
</gallery> | </gallery> | ||
| − | + | =='''Oct 2023 Energy Usage Charts'''== | |
| + | |||
<gallery> | <gallery> | ||
| − | Image:kWh | + | Image:GG DTE kWh for PL w Solar Oct 2023.png|Monthly kWh for Lighting and Plug Load with Solar |
| − | Image: | + | Image:GG Solar Gen & Usage for PL Oct 2023.png|Solar Generation and Usage for Lighting and Plug Load (kWh) |
| − | Image: | + | Image:GG Energy Costs for PL Oct 2023.png|Energy Costs for Lighting and Plug Loads |
| − | Image: | + | Image:GG Energy Costs per Person for PL Oct 2023.png|Energy Costs per Person for Lighting and Plug Loads |
| + | |||
| + | Image:GG kWh for HVAC Oct 2023.png|kWh for HVAC showing on-peak and off-peak hours | ||
| + | |||
| + | Image:GG Energy Use for HVAC w Solar Oct 2023.png|kWh for HVAC with Solar | ||
| + | |||
| + | Image:GG Solar Gen & Usage for HVAC Oct 2023.png|Solar Generation and Usage for HVAC | ||
| + | |||
| + | Image:GG EGB kWh Bal for HVAC Oct 2023.png|Excess Generation Bank Balance for HVAC (kWh) | ||
| + | |||
| + | Image:GG EGB $ Cr Bal for HVAC Oct 2023.png|Excess Generation Bank credit balance in dollars for HVAC | ||
| + | |||
| + | Image:GG Energy Costs for HVAC Oct 2023.png|Energy Costs for HVAC | ||
| + | |||
| + | Image:GG Energy Costs per Person for HVAC Oct 2023.png|Energy Costs per Person for HVAC | ||
</gallery> | </gallery> | ||
| − | + | ||
| + | =='''Sep 2023 Energy Usage Charts'''== | ||
| + | |||
<gallery> | <gallery> | ||
| − | Image: | + | Image:GG kWh for PL w-Solar Sep 2023.png|Monthly kWh for Lighting and Plug Load with Solar |
| − | Image: | + | Image:GG Solar Gen & Usage for PL Sep 2023.png|Solar Generation and Usage for Lighting and Plug Load (kWh) |
| − | Image:Energy Costs for HVAC | + | Image:GG Energy Costs for PL Sep 2023.png|Energy Costs for Lighting and Plug Loads |
| + | |||
| + | Image:GG Energy Costs per Person for PL Sep 2023.png|Energy Costs per Person for Lighting and Plug Loads | ||
| + | |||
| + | Image:GG kWh for HVAC Sep 2023.png|kWh for HVAC showing on-peak and off-peak hours | ||
| + | |||
| + | Image:GG Energy Usage for HVAC w Solar Sep 2023.png|kWh for HVAC with Solar | ||
| + | |||
| + | Image:GG Solar Gen & Usage for HVAC Sep 2023.png|Solar Generation and Usage for HVAC | ||
| + | |||
| + | Image:GG EGB kWh Bal for HVAC Sep 2023.png|Excess Generation Bank Balance for HVAC (kWh) | ||
| + | |||
| + | Image:GG EGB $ Cr Bal for HVAC Sep 2023.png|Excess Generation Bank credit balance in dollars for HVAC | ||
| + | |||
| + | Image:GG Energy Costs for HVAC.png|Energy Costs for HVAC | ||
| + | |||
| + | Image:GG Energy Costs per Person for HVAC Sep 2023.png|Energy Costs per Person for HVAC | ||
| − | |||
</gallery> | </gallery> | ||
| − | + | =='''Aug 2023 Energy Usage Charts'''== | |
| + | |||
<gallery> | <gallery> | ||
| − | Image: | + | Image:GG kWh for PL w Solar Aug 2023.png|Monthly kWh for Lighting and Plug Load with Solar |
| − | Image: | + | Image:GG Solar Gen & Usage for PL Aug 2023.png|Solar Generation and Usage for Lighting and Plug Load (kWh) |
| − | Image:Energy Costs Lighting | + | Image:GG EGB kWh Bal for PL Aug 2023.png|Excess Generation Bank kWh Balance for Lighting and Plug Loads |
| + | |||
| + | Image:GG EGB Cr Bal $ for PL Aug 2023.png|Excess Generation Bank $ Balance for Lighting and Plug Loads | ||
| + | |||
| + | Image:GG Energy Costs for PL Aug 2023.png|Energy Costs for Lighting and Plug Loads | ||
| + | |||
| + | Image:GG Energy Costs per Person for PL Aug 2023.png|Energy Costs per Person for Lighting and Plug Loads | ||
| + | |||
| + | Image:GG kWh for HVAC Aug 2023.png|kWh for HVAC showing on-peak and off-peak hours | ||
| + | |||
| + | Image:GG kWh for HVAC w Solar Aug 2023.png|kWh for HVAC with Solar | ||
| + | |||
| + | Image:GG Solar Gen & Usage for HVAC Aug 2023.png|Solar Generation and Usage for HVAC | ||
| + | |||
| + | Image:GG EGB Bal for HVAC kWh Aug 2023.png|Excess Generation Bank Balance for HVAC (kWh) | ||
| + | |||
| + | Image:GG EBG Cr Bal for HVAC $ Aug 2023.png|Excess Generation Bank credit balance in dollars for HVAC | ||
| + | |||
| + | Image:GG Energy Costs for HVAC Aug 2023.png|Energy Costs for HVAC | ||
| + | |||
| + | Image:GG Energy Costs per Person for HVAC Aug 2023.png|Energy Costs per Person for HVAC | ||
| − | |||
</gallery> | </gallery> | ||
| − | + | ||
| + | =='''May 2023 Energy Usage Charts'''== | ||
| + | |||
<gallery> | <gallery> | ||
| − | Image:Energy Costs per Person | + | Image:GG kWh for PL w Solar May 2023.png|Monthly kWh for Lighting and Plug Load with Solar |
| + | |||
| + | Image:GG Solar Gen & Usage for PL May 2023.png|Solar Generation and Usage for Lighting and Plug Load (kWh) | ||
| + | |||
| + | Image:GG EGB kWh Bal for PL May 2023.png|Excess Generation Bank kWh Balance for Lighting and Plug Loads | ||
| + | |||
| + | Image:GG EGB Cr Bal for PL May 2023.png|Excess Generation Bank $ Balance for Lighting and Plug Loads | ||
| + | |||
| + | Image:GG Energy Costs for PL May 2023.png|Energy Costs for Lighting and Plug Loads | ||
| + | |||
| + | Image:GG Energy Costs per Person PL May 2023.png|Energy Costs per Person for Lighting and Plug Loads | ||
| + | |||
| + | Image:GG kWh for HVAC May 2023.png|kWh for HVAC showing on-peak and off-peak hours | ||
| + | |||
| + | Image:GG kWh HVAC w Solar May 2023.png|kWh for HVAC with Solar | ||
| + | |||
| + | Image:GG Solar Gen & Usage HVAC May 2023.png|Solar Generation and Usage for HVAC | ||
| + | |||
| + | Image:GG EGB for HVAC kWh.png|Excess Generation Bank Balance for HVAC (kWh) | ||
| + | |||
| + | Image:GG EGB Cr Bal for HVAC May 2023.png|Excess Generation Bank credit balance in dollars for HVAC | ||
| + | |||
| + | Image:GG Energy Costs for HVAC May 2023.png|Energy Costs for HVAC | ||
| − | Image:Energy Costs per Person HVAC | + | Image:GG Energy Costs per Person HVAC May 2023.png|Energy Costs per Person for HVAC |
| − | |||
| − | |||
</gallery> | </gallery> | ||
| − | + | =='''April 2023 Energy Usage Charts'''== | |
| + | |||
<gallery> | <gallery> | ||
| + | Image:GG Energy Use for PL w Solar Apr 2023.png|Monthly kWh for Lighting and Plug Load with Solar | ||
| − | Image: | + | Image:GG Solar Gen & Usage for PL Apr 2023.png|Solar Generation and Usage for Lighting and Plug Load (kWh) |
| − | Image: | + | Image:GG EGB Bal for PL kWh Apr 2023.png|Excess Generation Bank kWh Balance for Lighting and Plug Loads |
| − | Image: | + | Image:GG EGB Bal for PL $ Apr 2023.png|Excess Generation Bank $ Balance for Lighting and Plug Loads |
| − | Image:Energy Costs per Person | + | Image:GG Energy Costs for PL Apr 2023.png|Energy Costs for Lighting and Plug Loads |
| + | |||
| + | Image:GG Energy Costs per Person PL Apr 2023.png|Energy Costs per Person for Lighting and Plug Loads | ||
| + | |||
| + | Image:GG kWh for HVAC Apr 2023.png|kWh for HVAC showing on-peak and off-peak hours | ||
| + | |||
| + | Image:GG Energy Use for HVAC w Solar Apr 2023.png|kWh for HVAC with Solar | ||
| + | |||
| + | Image:GG Solar Gen & Usage for HVAC Apr 2023.png|Solar Generation and Usage for HVAC | ||
| + | |||
| + | Image:GG EGB Bal for HVAC kWh Apr 2023.png|Excess Generation Bank Balance for HVAC (kWh) | ||
| + | |||
| + | Image:EGB Bal for HVAC $ Apr 2023.png|Excess Generation Bank credit balance in dollars for HVAC | ||
| + | |||
| + | Image:GG Energy Costs for HVAC Apr 2023.png|Energy Costs for HVAC | ||
| + | |||
| + | Image:GG Energy Costs per Person HVAC Apr 2023.png|Energy Costs per Person for HVAC | ||
</gallery> | </gallery> | ||
| + | <br style="clear:both;"/> | ||
| + | |||
| + | ==See Also== | ||
| + | For past years' charts, see [[Energy Charts Archives]] | ||
Latest revision as of 19:56, 31 January 2024
return to Measurement Pages
We have 2 meters for energy, one for our HVAC system and one for any other electrical use, including computers, appliances and lighting.
Contents
Current 2023 Usage Charts
- There were 79 people in the building in Dec 2023

- These usage statistics show total kWh used each month from both DTE and solar panel generation and include lighting, appliances and all other plug loads.

- This chart shows Solar kWh generated, kWh Outflow, and total Solar kWh Usage for Green Garage lighting and plug loads.


- Peak period is between 10:00 AM and 7:00 PM May - Oct. Off-peak is 7:00 PM - 10:00 AM May - Oct.


- This chart shows solar kWh generated, kWh outflow, and solar kWh usage for HVAC.


- These usage statistics include the heat pump, ventilation fans, hydronic pumps and valves, energy recovery unit, and domestic hot water.
- Costs include the direct cost for electrical energy generation, distribution, and service connection charges, but exclude taxes and special charges.

Nov 2023 Energy Usage Charts
Monthly kWh for Lighting and Plug Load with Solar

Solar Generation and Usage for Lighting and Plug Load (kWh)

Energy Costs for Lighting and Plug Loads

Energy Costs per Person for Lighting and Plug Loads

kWh for HVAC showing on-peak and off-peak hours

kWh for HVAC with Solar

Solar Generation and Usage for HVAC

Excess Generation Bank Balance for HVAC (kWh)

Excess Generation Bank credit balance in dollars for HVAC

Energy Costs for HVAC

Energy Costs per Person for HVAC


Oct 2023 Energy Usage Charts

Monthly kWh for Lighting and Plug Load with Solar

Solar Generation and Usage for Lighting and Plug Load (kWh)

Energy Costs for Lighting and Plug Loads

Energy Costs per Person for Lighting and Plug Loads

kWh for HVAC showing on-peak and off-peak hours

kWh for HVAC with Solar
Solar Generation and Usage for HVAC

Excess Generation Bank Balance for HVAC (kWh)

Excess Generation Bank credit balance in dollars for HVAC

Energy Costs for HVAC

Energy Costs per Person for HVAC


Sep 2023 Energy Usage Charts

Monthly kWh for Lighting and Plug Load with Solar

Solar Generation and Usage for Lighting and Plug Load (kWh)
Energy Costs for Lighting and Plug Loads

Energy Costs per Person for Lighting and Plug Loads

kWh for HVAC showing on-peak and off-peak hours

kWh for HVAC with Solar

Solar Generation and Usage for HVAC

Excess Generation Bank Balance for HVAC (kWh)

Excess Generation Bank credit balance in dollars for HVAC
Energy Costs for HVAC
Energy Costs per Person for HVAC


Aug 2023 Energy Usage Charts

Monthly kWh for Lighting and Plug Load with Solar

Solar Generation and Usage for Lighting and Plug Load (kWh)

Excess Generation Bank kWh Balance for Lighting and Plug Loads
Excess Generation Bank $ Balance for Lighting and Plug Loads

Energy Costs for Lighting and Plug Loads

Energy Costs per Person for Lighting and Plug Loads

kWh for HVAC showing on-peak and off-peak hours

kWh for HVAC with Solar

Solar Generation and Usage for HVAC

Excess Generation Bank Balance for HVAC (kWh)

Excess Generation Bank credit balance in dollars for HVAC

Energy Costs for HVAC
Energy Costs per Person for HVAC


May 2023 Energy Usage Charts

Monthly kWh for Lighting and Plug Load with Solar

Solar Generation and Usage for Lighting and Plug Load (kWh)

Excess Generation Bank kWh Balance for Lighting and Plug Loads

Excess Generation Bank $ Balance for Lighting and Plug Loads

Energy Costs for Lighting and Plug Loads

Energy Costs per Person for Lighting and Plug Loads

kWh for HVAC showing on-peak and off-peak hours

kWh for HVAC with Solar

Solar Generation and Usage for HVAC

Excess Generation Bank Balance for HVAC (kWh)

Excess Generation Bank credit balance in dollars for HVAC

Energy Costs for HVAC

Energy Costs per Person for HVAC


April 2023 Energy Usage Charts
Monthly kWh for Lighting and Plug Load with Solar

Solar Generation and Usage for Lighting and Plug Load (kWh)

Excess Generation Bank kWh Balance for Lighting and Plug Loads

Excess Generation Bank $ Balance for Lighting and Plug Loads

Energy Costs for Lighting and Plug Loads

Energy Costs per Person for Lighting and Plug Loads

kWh for HVAC showing on-peak and off-peak hours

kWh for HVAC with Solar

Solar Generation and Usage for HVAC

Excess Generation Bank Balance for HVAC (kWh)

Excess Generation Bank credit balance in dollars for HVAC

Energy Costs for HVAC

Energy Costs per Person for HVAC


See Also
For past years' charts, see Energy Charts Archives