Difference between revisions of "Energy - Electrical Usage Statistics"
(→Energy Usage Charts) |
|||
| Line 58: | Line 58: | ||
Image: kWh for HVAC July 2014.png|Monthly kWh for HVAC (Peak/Off-Peak) July 2013 - July 2014 | Image: kWh for HVAC July 2014.png|Monthly kWh for HVAC (Peak/Off-Peak) July 2013 - July 2014 | ||
| + | |||
| + | Image: kWh for HVAC Aug 2014.png|Monthly kWh for HVAC (Peak/Off-Peak) August 2013 - August 2014 | ||
</gallery> | </gallery> | ||
| Line 73: | Line 75: | ||
Image:kWh Lighting July 2014.png|Monthly kWh for Lighting, Computers, Appliances, July 2013 - July 2014 | Image:kWh Lighting July 2014.png|Monthly kWh for Lighting, Computers, Appliances, July 2013 - July 2014 | ||
| + | |||
| + | Image:kWh Lighting Aug 2014.png|Monthly kWh for Lighting, Computers, Appliances, August 2013 - August 2014 | ||
</gallery> | </gallery> | ||
| Line 88: | Line 92: | ||
Image:Energy Costs for HVAC July 2014.png|Monthly costs for HVAC July 2013 - July 2014 | Image:Energy Costs for HVAC July 2014.png|Monthly costs for HVAC July 2013 - July 2014 | ||
| + | |||
| + | Image:Energy Costs for HVAC Aug 2014.png|Monthly costs for HVAC August 2013 - August 2014 | ||
</gallery> | </gallery> | ||
| Line 103: | Line 109: | ||
Image:Energy Costs Lighting July 2014.png|Monthly costs for Lighting, Computers, Appliances July 2013 - July 2014 | Image:Energy Costs Lighting July 2014.png|Monthly costs for Lighting, Computers, Appliances July 2013 - July 2014 | ||
| + | |||
| + | Image:Energy Costs for Lighting Aug 2014.png|Monthly costs for Lighting, Computers, Appliances August 2013 - August 2014 | ||
</gallery> | </gallery> | ||
| Line 118: | Line 126: | ||
Image:Energy Costs per Person HVAC July 2014.png|Energy Costs per Person HVAC July 2013 - July 2014 | Image:Energy Costs per Person HVAC July 2014.png|Energy Costs per Person HVAC July 2013 - July 2014 | ||
| + | |||
| + | Image:Energy Costs per Person HVAC Aug 2014.png|Energy Costs per Person HVAC August 2013 - August 2014 | ||
</gallery> | </gallery> | ||
| Line 134: | Line 144: | ||
Image:Energy Costs per Person Light July 2014.png|Energy Costs per Person for Lighting, Computers, Appliances July 2013 - July 2014 | Image:Energy Costs per Person Light July 2014.png|Energy Costs per Person for Lighting, Computers, Appliances July 2013 - July 2014 | ||
| + | |||
| + | Image:Energy Costs per Person Light Aug 2014.png|Energy Costs per Person for Lighting, Computers, Appliances August 2013 - August 2014 | ||
</gallery> | </gallery> | ||
Revision as of 18:12, 21 October 2014
return to Measurement Pages
We have 2 meters for energy, one for our HVAC system and one for any other electrical use, including computers and lighting.
Energy Usage Charts
There were 98 people in the building in September 2014

- These usage statistics include lighting, computers, chargers, refrigerator, dishwasher, microwave, printer, etc.

- These usage statistics include the heat pump, ventilation fans, hydronic pumps and valves, energy recovery unit, and domestic hot water.
- Peak period is between 10:00 AM and 7:00 PM May - Oct. Off-peak is 7:00 PM - 10:00 AM May - Oct.

- These usage statistics include lighting, computers, chargers, refrigerator, dishwasher, microwave, printer, etc.
- Costs include the direct cost for electrical energy generation, distribution, and service connection charges, but exclude taxes and special charges.

- These usage statistics include the heat pump, ventilation fans, hydronic pumps and valves, energy recovery unit, and domestic hot water.
- Costs include the direct cost for electrical energy generation, distribution, and service connection charges, but exclude taxes and special charges.

- Costs include the direct cost for electrical energy generation, distribution, and service connection charges, but exclude taxes and special charges.

- Costs include the direct cost for electrical energy generation, distribution, and service connection charges, but exclude taxes and special charges.
Past Electrical Usage Charts
kWh for HVAC

Monthly kWh for HVAC (Peak/Off-Peak) March 2013 - March 2014

Monthly kWh for HVAC (Peak/Off-Peak) April 2013 - April 2014

Monthly kWh for HVAC (Peak/Off-Peak) May 2013 - May 2014

Monthly kWh for HVAC (Peak/Off-Peak) June 2013 - June 2014

Monthly kWh for HVAC (Peak/Off-Peak) July 2013 - July 2014

Monthly kWh for HVAC (Peak/Off-Peak) August 2013 - August 2014


kWh for non-HVAC (Lighting, Computers and Appliances)

Monthly kWh for non-HVAC energy March 2013 - March 2014

Monthly kWh for Lighting, Computers, Appliances, April 2013 - April 2014

Monthly kWh for Lighting, Computers, Appliances, May 2013 - May 2014

Monthly kWh for Lighting, Computers, Appliances, June 2013 - June 2014

Monthly kWh for Lighting, Computers, Appliances, July 2013 - July 2014

Monthly kWh for Lighting, Computers, Appliances, August 2013 - August 2014


Energy Costs for HVAC

Monthly costs for HVAC March 2013 - March 2014

Monthly costs for HVAC April 2013 - April 2014

Monthly costs for HVAC May 2013 - May 2014

Monthly costs for HVAC June 2013 - June 2014

Monthly costs for HVAC July 2013 - July 2014

Monthly costs for HVAC August 2013 - August 2014


Energy Costs for Lighting, Computers and Appliances

Monthly costs for non-HVAC energy March 2013 - March 2014

Monthly costs for Lighting, Computers, Appliances April 2013 - April 2014

Monthly costs for Lighting, Computers, Appliances May 2013 - May 2014

Monthly costs for Lighting, Computers, Appliances June 2013 - June 2014

Monthly costs for Lighting, Computers, Appliances July 2013 - July 2014

Monthly costs for Lighting, Computers, Appliances August 2013 - August 2014


Energy Costs per Person for HVAC

Energy Costs per Person HVAC March 2013 - March 2014

Energy Costs per Person HVAC April 2013 - April 2014

Energy Costs per Person HVAC May 2013 - May 2014

Energy Costs per Person HVAC June 2013 - June 2014

Energy Costs per Person HVAC July 2013 - July 2014

Energy Costs per Person HVAC August 2013 - August 2014


Energy Costs per Person for Lighting, Computers and Appliances

Energy Costs per Person non-HVAC energy March 2013 - March 2014

Energy Costs per Person for Lighting, Computers, Appliances April 2013 - April 2014

Energy Costs per Person for Lighting, Computers, Appliances May 2013 - May 2014
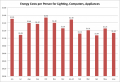
Energy Costs per Person for Lighting, Computers, Appliances June 2013 - June 2014

Energy Costs per Person for Lighting, Computers, Appliances July 2013 - July 2014

Energy Costs per Person for Lighting, Computers, Appliances August 2013 - August 2014


