Difference between revisions of "Energy - Electrical Usage Statistics"
From Green Garage Detroit
(→Energy Usage Charts) |
|||
| Line 8: | Line 8: | ||
---- | ---- | ||
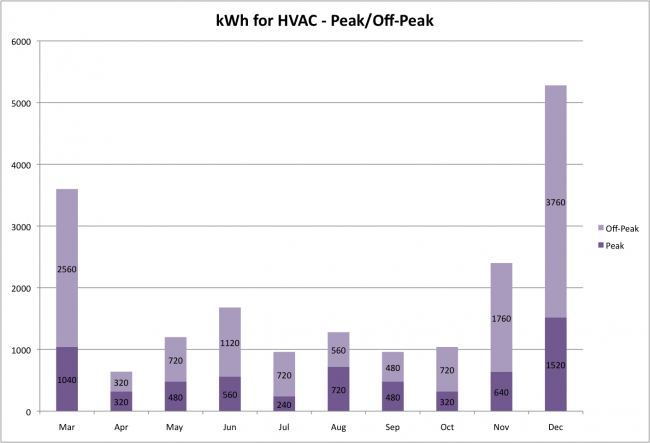
| − | [[Image: | + | [[Image:kWh HVAC Dec 2013.png|650px|thumb|left|Monthly kWh for HVAC (Peak/Off-Peak) March 2013 - December 2013]] |
* These usage statistics include the heat pump, ventilation fans, hydronic pumps and valves, energy recovery unit, and domestic hot water. | * These usage statistics include the heat pump, ventilation fans, hydronic pumps and valves, energy recovery unit, and domestic hot water. | ||
| Line 22: | Line 22: | ||
<br style="clear:both;"/> | <br style="clear:both;"/> | ||
---- | ---- | ||
| − | [[Image:Energy Costs HVAC | + | [[Image:Energy Costs for HVAC Dec 2013.png|650px|thumb|left|Monthly costs for HVAC March 2013 - December 2013]] |
* These usage statistics include the heat pump, ventilation fans, hydronic pumps and valves, energy recovery unit, and domestic hot water. | * These usage statistics include the heat pump, ventilation fans, hydronic pumps and valves, energy recovery unit, and domestic hot water. | ||
* Costs include the direct cost for electrical energy generation, distribution, and service connection charges, but exclude taxes and special charges. | * Costs include the direct cost for electrical energy generation, distribution, and service connection charges, but exclude taxes and special charges. | ||
| Line 28: | Line 28: | ||
<br style="clear:both;"/> | <br style="clear:both;"/> | ||
---- | ---- | ||
| − | [[Image:Energy Costs per Person HVAC | + | [[Image:Energy Costs per Person HVAC Dec 2013.png|650px|thumb|left|Energy Costs per Person HVAC March 2013 - December 2013]] |
* Costs include the direct cost for electrical energy generation, distribution, and service connection charges, but exclude taxes and special charges. | * Costs include the direct cost for electrical energy generation, distribution, and service connection charges, but exclude taxes and special charges. | ||
Revision as of 16:29, 21 January 2014
Energy Usage Charts
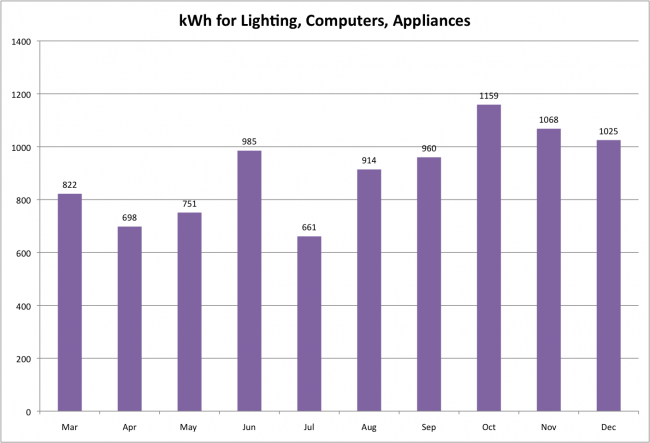
- These usage statistics include lighting, computers, chargers, refrigerator, dishwasher, microwave, printer, etc.
- These usage statistics include the heat pump, ventilation fans, hydronic pumps and valves, energy recovery unit, and domestic hot water.
- Peak period is between 10:00 AM and 7:00 PM May - Oct. Off-peak is 7:00 PM - 10:00 AM May - Oct.
- These usage statistics include lighting, computers, chargers, refrigerator, dishwasher, microwave, printer, etc.
- Costs include the direct cost for electrical energy generation, distribution, and service connection charges, but exclude taxes and special charges.
- With 91 people in the building for the month of November, our energy costs have dropped slightly from the prior month.
- These usage statistics include the heat pump, ventilation fans, hydronic pumps and valves, energy recovery unit, and domestic hot water.
- Costs include the direct cost for electrical energy generation, distribution, and service connection charges, but exclude taxes and special charges.
- Costs include the direct cost for electrical energy generation, distribution, and service connection charges, but exclude taxes and special charges.
- Costs include the direct cost for electrical energy generation, distribution, and service connection charges, but exclude taxes and special charges.


